The Winners' Playbook
What the top 4% of Shopify apps do differently. Measured, not guessed.
Every number here comes from AppstorePulse.
Keyword rankings, competitor alerts and review intelligence for your Shopify app.
Six things anyone can copy
Languages
Top apps ship their listing in about 7 languages, small apps in 2. Their reviews arrive in 15 languages from 44 countries versus 2.5 languages from 6. The steepest gap in the entire dataset, and it repeats everywhere: top-3 ranked apps average 6.7 languages, breakout launches 4.5 against 2.0 for the ones that stalled.
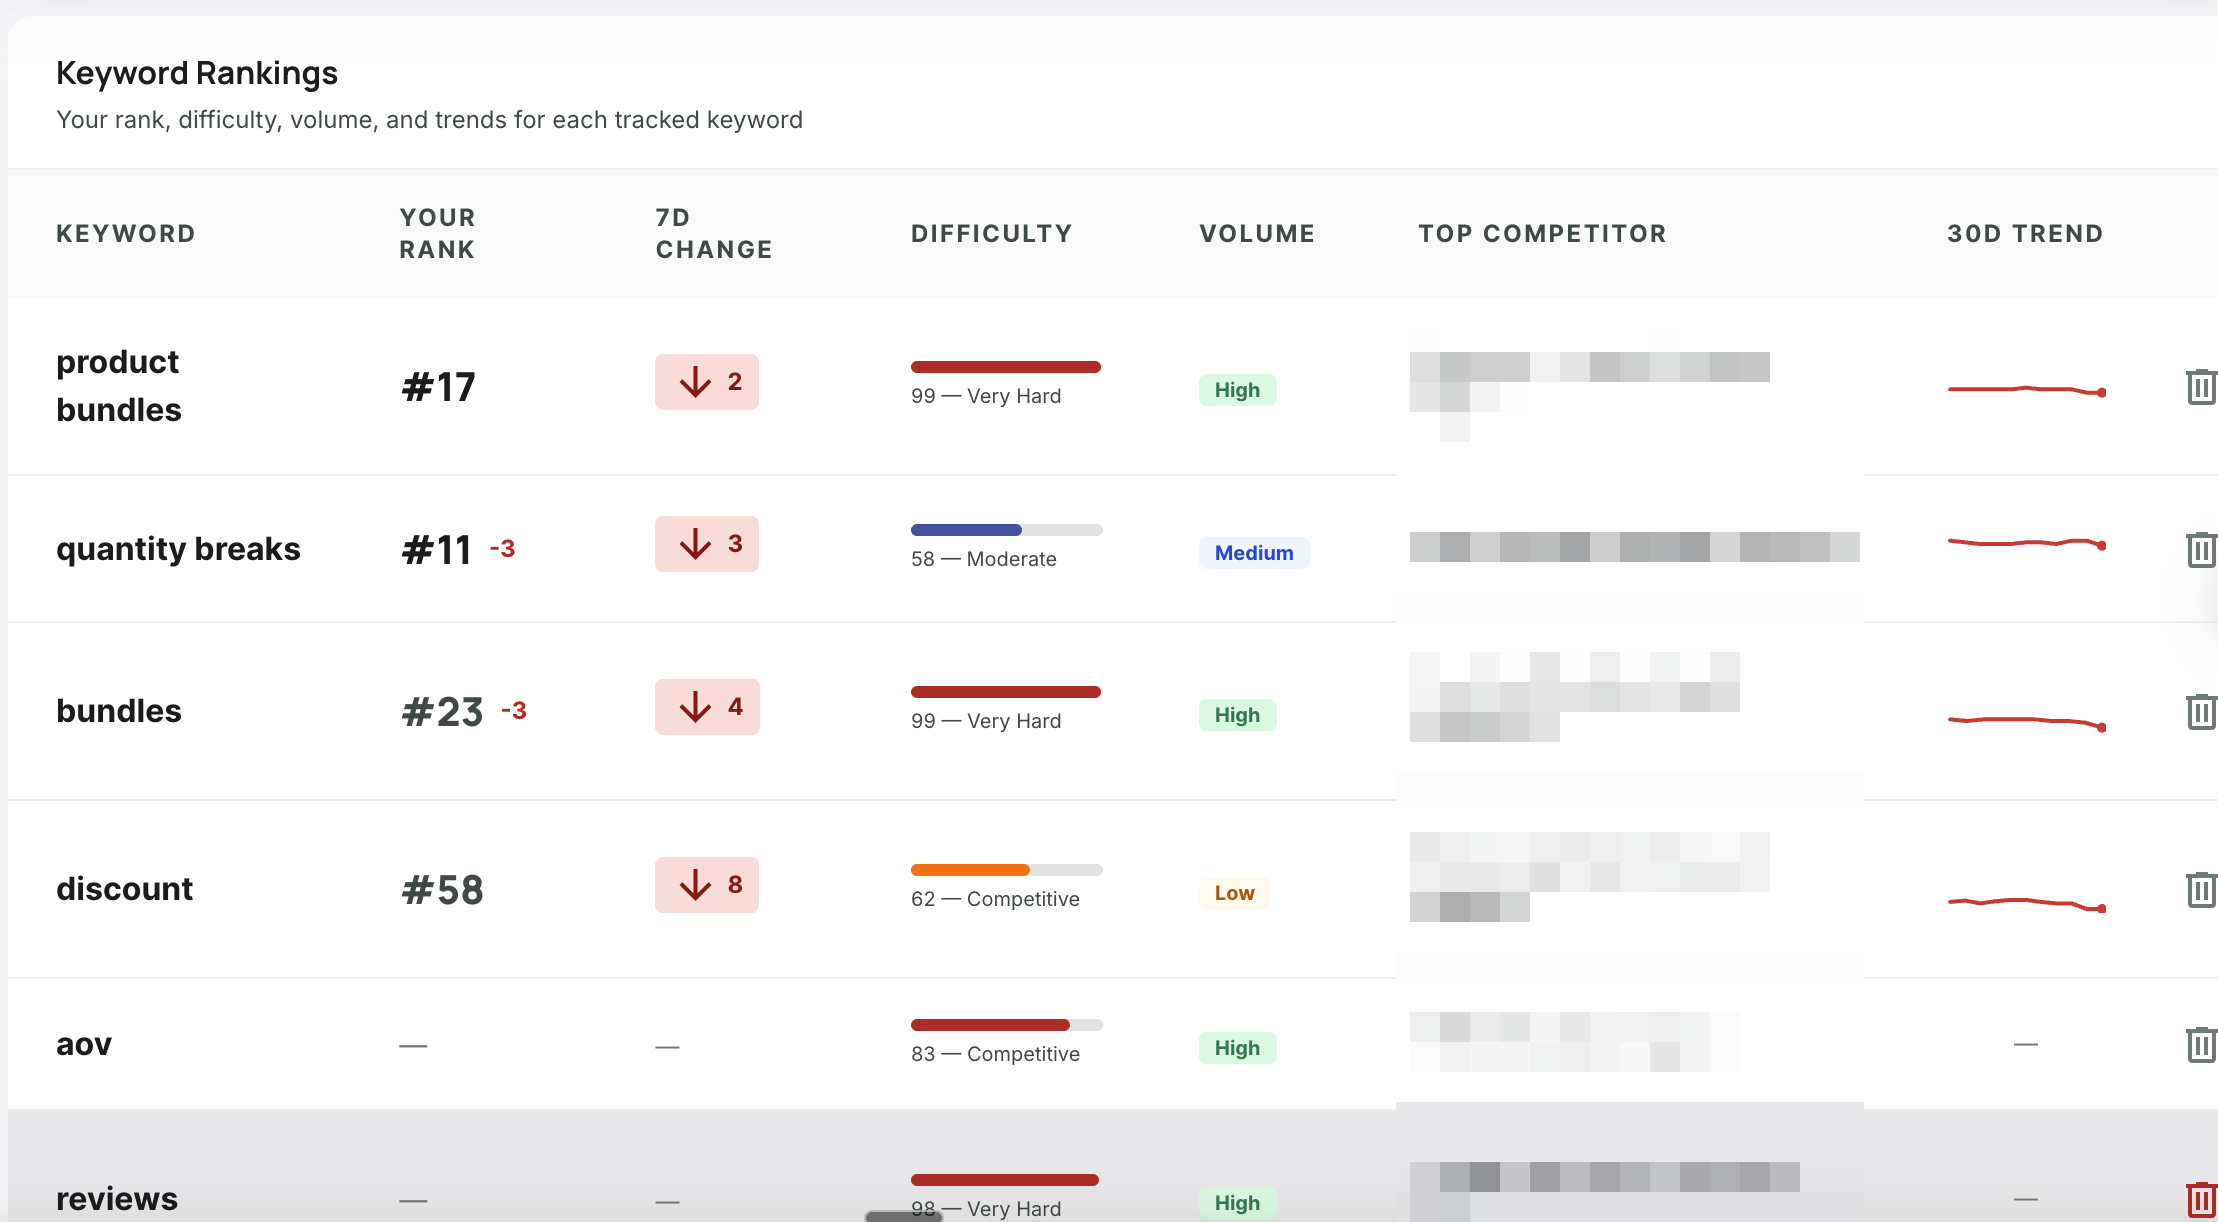
Multi-language keyword tracking shows your rankings in every locale.
Days before a review
Merchants who review a top app have used it for a median of 90 days. For small apps, 23. Winners keep merchants long enough to earn considered verdicts instead of first-week impressions.
Reviews analysis shows what long-term users praise and what makes early users leave.
Angry reviews
Only 3.3% of a top app's reviews are 1 or 2 stars, against 6.8% for small apps. The averages barely differ (4.85 vs 4.77): what separates winners is the missing tail of angry reviews, not a higher average.
Review alerts flag every negative review the day it lands, while it can still be fixed.
Free plan
84 to 88% of top apps offer a free plan versus about 66% below, and among new launches that broke through in their first months, 85% had one. The clearest pricing decision on the board.
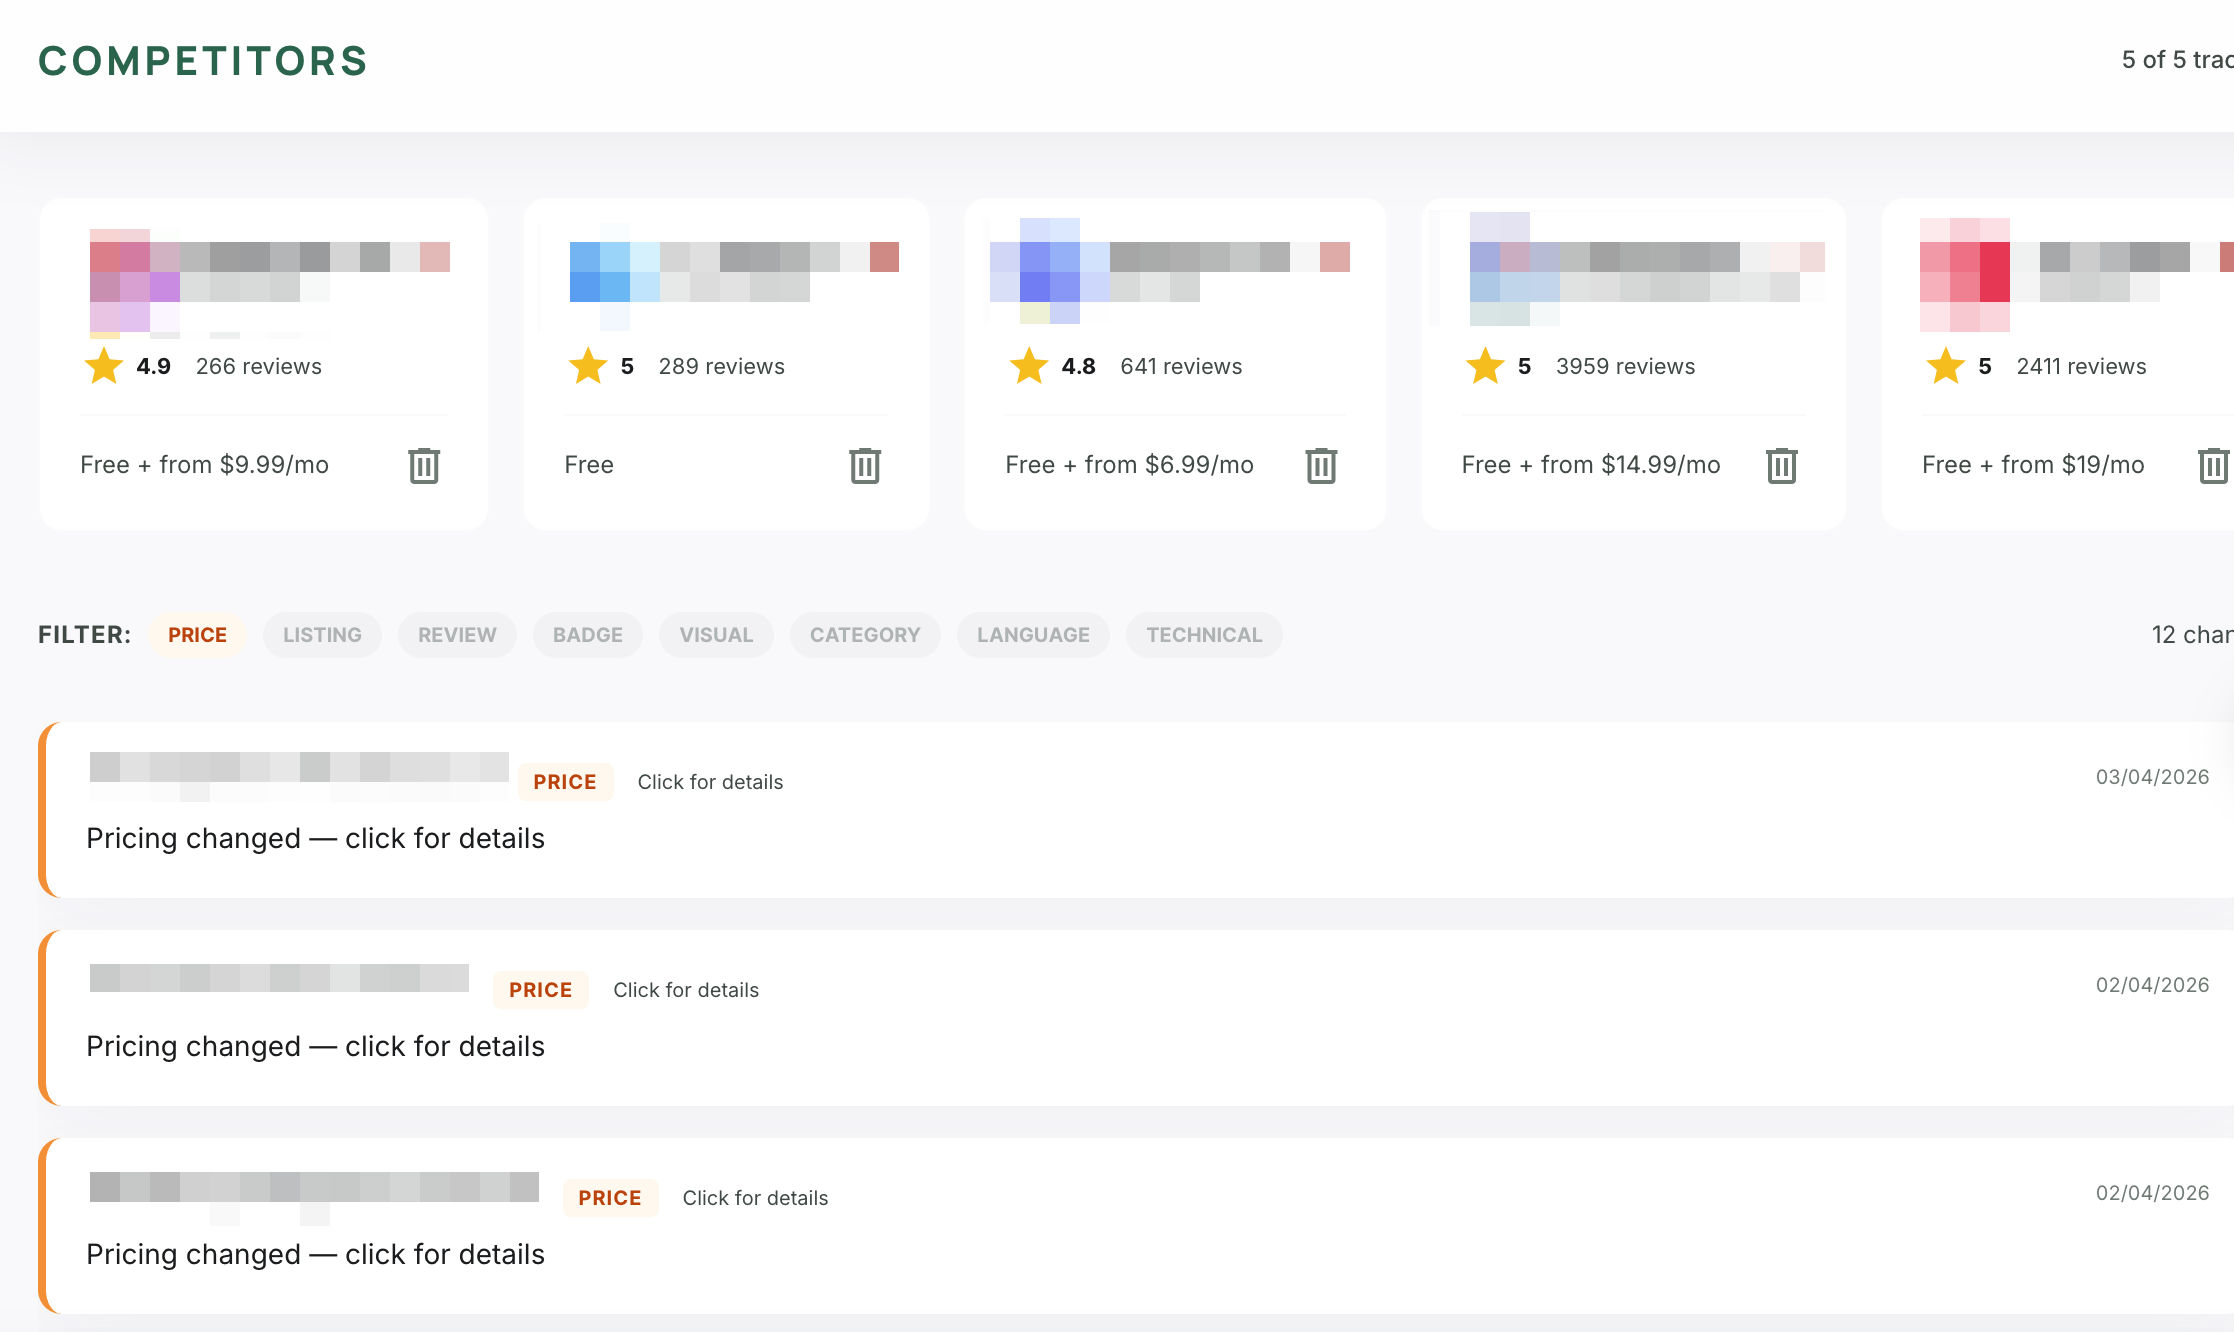
Competitor tracking shows every pricing move in your category within 24 hours.
Feature tags
Top apps carry around 25 feature tags and sit in 1.8 categories. Small apps: 8 tags, 1.4 categories. More surfaces in the store means more ways to be found.
The Listing Optimizer scores your tags and categories against your category's leaders.
Integrations
More than half of top apps list at least one integration, less than a third of small apps do. Winners position inside other tools' worlds instead of standing alone.
See which integrations the leaders in your niche declare, app by app.
The ladder, position by position
383,000 ranked search positions, profiled. What listings look like at each depth of the results.
| Attribute | Pos 1-3 | 4-10 | 11-16 | 17-100 |
|---|---|---|---|---|
| Languages | 6.7 | 5.9 | 5.4 | 3.9 |
| Free plan | 84% | 83% | 81% | 75% |
| Feature tags | 24.8 | 24.1 | 23.1 | 19.5 |
| Screenshots | 6.6 | 6.5 | 6.3 | 5.9 |
| Rating | 4.85 | 4.82 | 4.82 | 4.77 |
| Video (flat: the myth) | 31% | 31% | 30% | 31% |
The 1.8% that break out
Of 5,763 apps launched this spring, only 103 reached 10+ reviews. Same age, same starting line. What the breakouts did differently on day one:
Four myths, measured to death
31% of apps have one at every single rank position, and breakout launches actually have less video than the apps that failed. Zero correlation, everywhere we looked.
Top and small apps reply at the same 25% rate with the same 2-day median delay. Reply theater does not separate winners from losers.
Name, tagline and description lengths are flat across all rank positions. It is what you write, never how much.
Effectively 100% of apps have one, at every tier. Table stakes, not an edge.
Your checklist
None of this works blind.